
We have a few days until the next Chelsea match-cum-cold-shower-of-apocalyptic-emotions, so let's do something slightly different. How about some cold, hard FACTS? I bet the manager would appreciate that. He sure does like his facts, doesn't he? Oh right. Bad emotions. Boo, bad emotions. Bad! Shoo.
If you follow hockey, you should be familiar with plus/minus statistics. If you don't - or if you do - you can take a look at last season's Chelsea +/- statistics, too. Part I explains things a bit and contrasts Andre Villas-Boas with Roberto Di Matteo (may they both rest easy in their non-Chelsea anti-hell). Part II breaks the numbers down to individual players and positions, while Part III looks at specific player partnerships. I plan to follow this post with similar breakdowns in the next few days.
This season we've been blessed ("blessed") with two managers (so far) who have almost exclusively used the same exact formation. Both have shoved players into interesting and surprising roles (Paulo Ferreira , RIGHT WING!) and when they haven't, to make my own data-gathering job easier, I shoved them there myself (4-3-3 is a myth).
The following statistics have been updated through Wednesday's match and include the random bits of crap like the Community Shield or the Super Cup as well:
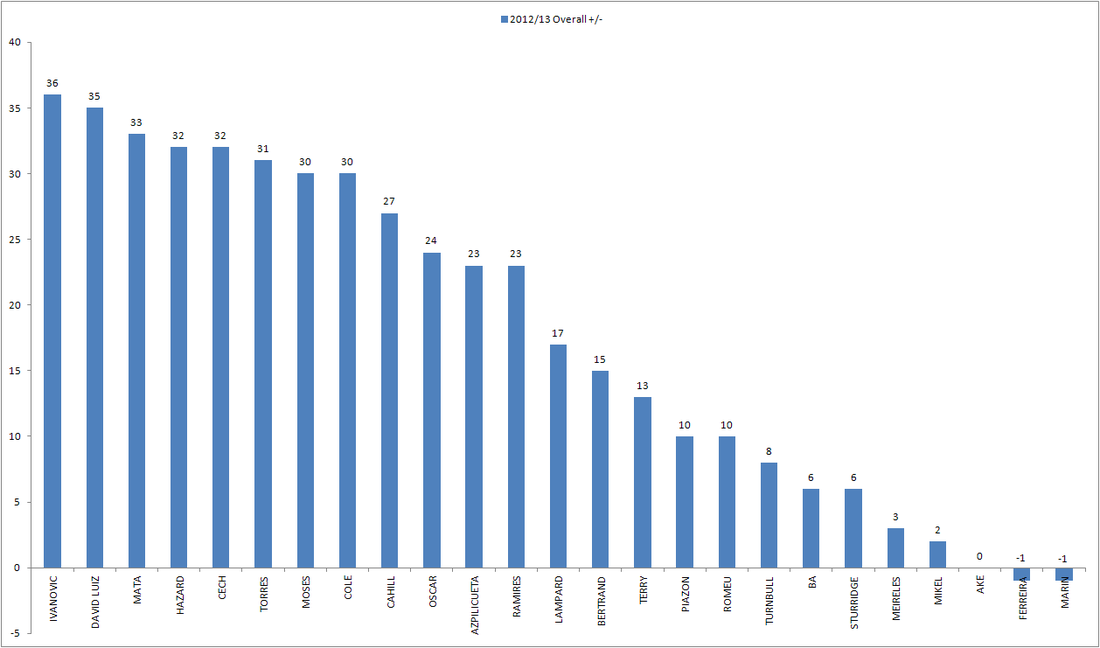
Thanks to a few blowout victories, the overall numbers actually look quite favorable when compared with last season. Already eight players are at or above +30, matching the Champions League winning squad's entire season!
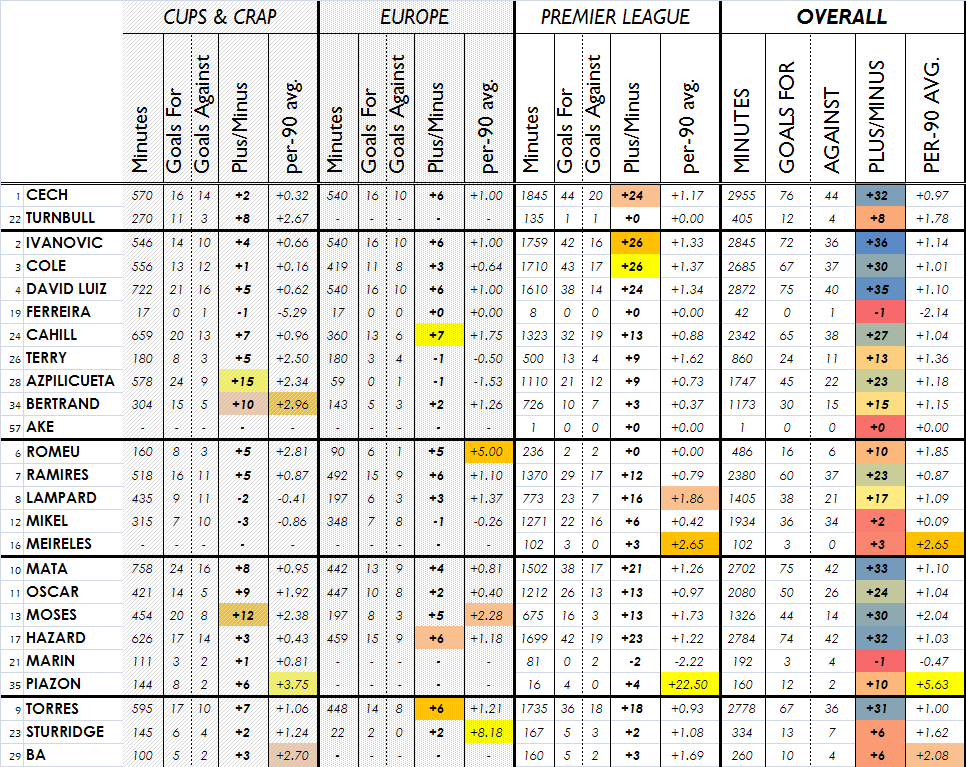
There's much to peruse here; here's what jumps out at me. (On the shading for the overall numbers, blue is good and red is bad - just as the laws of the game hath written it onto us.)
It's not surprising that the two players with the most minutes also occupy the top two spots overall in plus/minus as well. This statistic, after all, is cumulative and thus at a glance even makes Fernando Torres awesome. Juan Mata does sneak into third however, despite being just fifth overall in minutes. All of them would look even better had the statistical leader not literally given away two goals to Swansea. Chin up, Bane!
At the opposite end, Paulo Ferreira and Marko Marin carry the dubious honor of being in the red, while it's hard to overlook just how poor John Obi Mikel has performed in this statistical category. Then again, he's the only third line enforcer on the club. So is it just bad timing that he has missed every single blowout win (6-0 Wolves, 6-1 FCN, 8-0 Villa, 5-1 Leeds, 5-1 Southampton, 4-0 Stoke, most of 4-0 FCN away) or is it a proper reflection of the player himself that he was out there for three of the darkest days (1-4 Atletico, 0-3 Juventus, 1-3 West Ham)? The answer, I suppose, will depend on just how much you rate Mikel's abilities. Of course, plus/minus is just a simple statistic and is not meant as an end-all/be-all of a player's worth & performance.
We only have to look at the now injured Oriol Romeu for an "anti-Mikel." Romeu looks great at +10, until you realize that he's a +11 just from the aforementioned 6-0 and 6-1 shellackings. Similarly grabbing limited opportunities with all their might are players like Lucas Piazon or even cup-specialists Cesar Azpilicueta and Ryan Bertrand.
While Branislav Ivanovic, Ashley Cole, and Petr Cech lead the charts in Premier League plus/minus, when you break it down to a per-90 average, it is none other than Frank Lampard who's practically the best. His +1.86/per-90 is almost double that of Torres and about 50% better than both Mata and Eden Hazard. Fellow Old Guard John Terry similarly leads all defenders with a +1.62/per-90 in the Premier League.
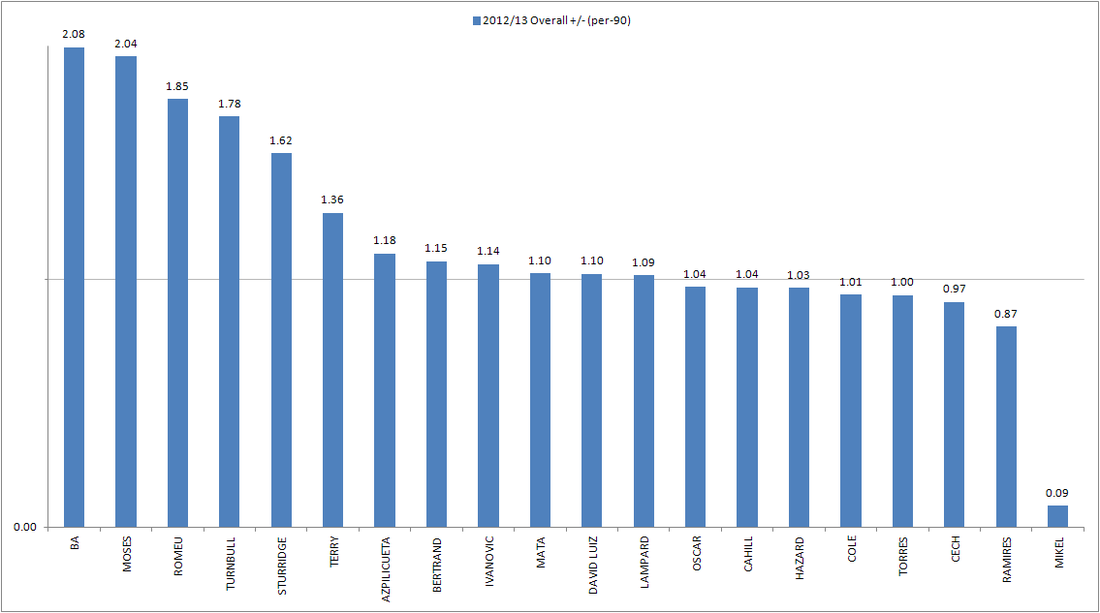
The true star of the per-90 breakdown however is Victor Moses. He was starting to spread his wings under Di Matteo already but has really come into his own lately. And since I conveniently set the minimum limit for inclusion in the above graph at 259 minutes, Demba Ba's +6 in just 260 minutes played makes him the current leader. But really, who doesn't love Demba Ba, already?
The horizontal line in the graph is at +1.07, which is the overall plus/minus-per-90-minutes baseline considering the entire Chelsea 2012/13 season so far. There are some surprising names below this standard, although many of them are in a similar, if not nearly as extreme of a situation as Mikel. Certainly nobody should be advocating that Ross Turnbull replace Petr Cech anytime soon.
Lastly for today, let's take a quick look how certain key players compare across managers and seasons. Again, this is not a final or comprehensive judgment on anybody involved, although if you're a fan of the current manager, you'll enjoy this.
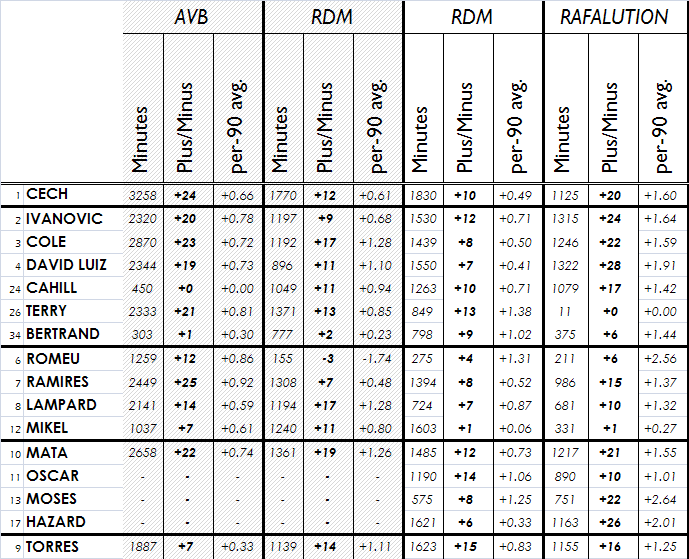
If only we could drown out the pain with a few more blowout wins. Except for Oscar. Poor little Oscar, he's not feeling the +/- improvements that almost every other player examined has. Eye-popping improvement from Eden Hazard. Since AVB got the boot, Torres has probably been the most consistent performer in this statistical category, rating right around a steady +1/per-90.
So, perhaps not that much insight to gain. At least not yet. Maybe when we look a bit deeper and examine individual players and partnership, we'll find something interesting. Until next time...
~We Ain't Got No History - All Posts~Read more... http://www.chelseamashup.com/2013/01/18/201213-chelsea-statistics-plusminus-overview-the-story-so-far/
No comments:
Post a Comment